Menu

Data Analytics

Blinkit Dashboard

Strategic quick-commerce performance analytics.

TimelineNov 2025 - Dec 2025
RoleData Analyst
Blinkit Dashboard

Executive Summary

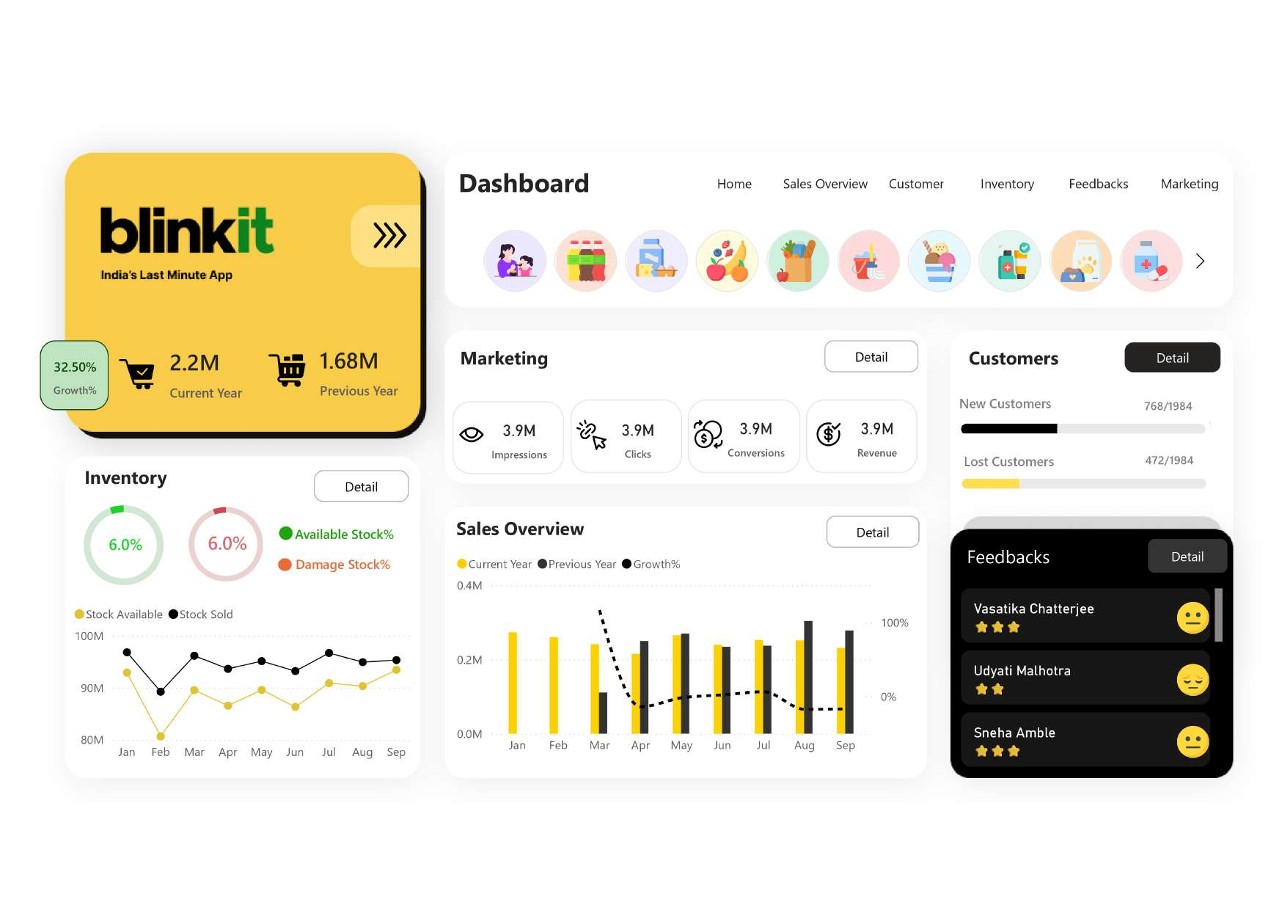
Overview: A comprehensive Business Intelligence dashboard designed to visualize and track key quick-commerce metrics. It enables operational teams to identify bottlenecks in delivery times and inventory turnover.

The Problem

Quick-commerce relies on sub-10-minute deliveries. Raw data logs were too massive to parse manually, leading to delayed decisions on warehouse staffing and inventory restocks. This dashboard brings real-time clarity to operational health.

Key Features

Delivery Time Analytics

Granular breakdown of order-to-delivery timelines across various dark stores.

Inventory Turnover Tracking

Highlights fast-moving vs. stagnant inventory.

Heatmaps

Geospatial visualization of high-demand areas.

Engineering Challenges & Solutions

Challenge

Processing millions of raw order rows efficiently

Solution

Built Python scripts for pre-aggregation and utilized DAX optimizations to ensure Power BI visual renderings remained under 3 seconds.

Key Learnings

  • Advanced DAX scripting for complex time-intelligence queries.
  • Data storytelling techniques to highlight actionable KPIs rather than just vanity metrics.

Future Roadmap

  • Automate data pipelines using Apache Airflow.
  • Integrate predictive models for demand forecasting.

Gallery

Blinkit Dashboard screenshot 1
Blinkit Dashboard screenshot 2